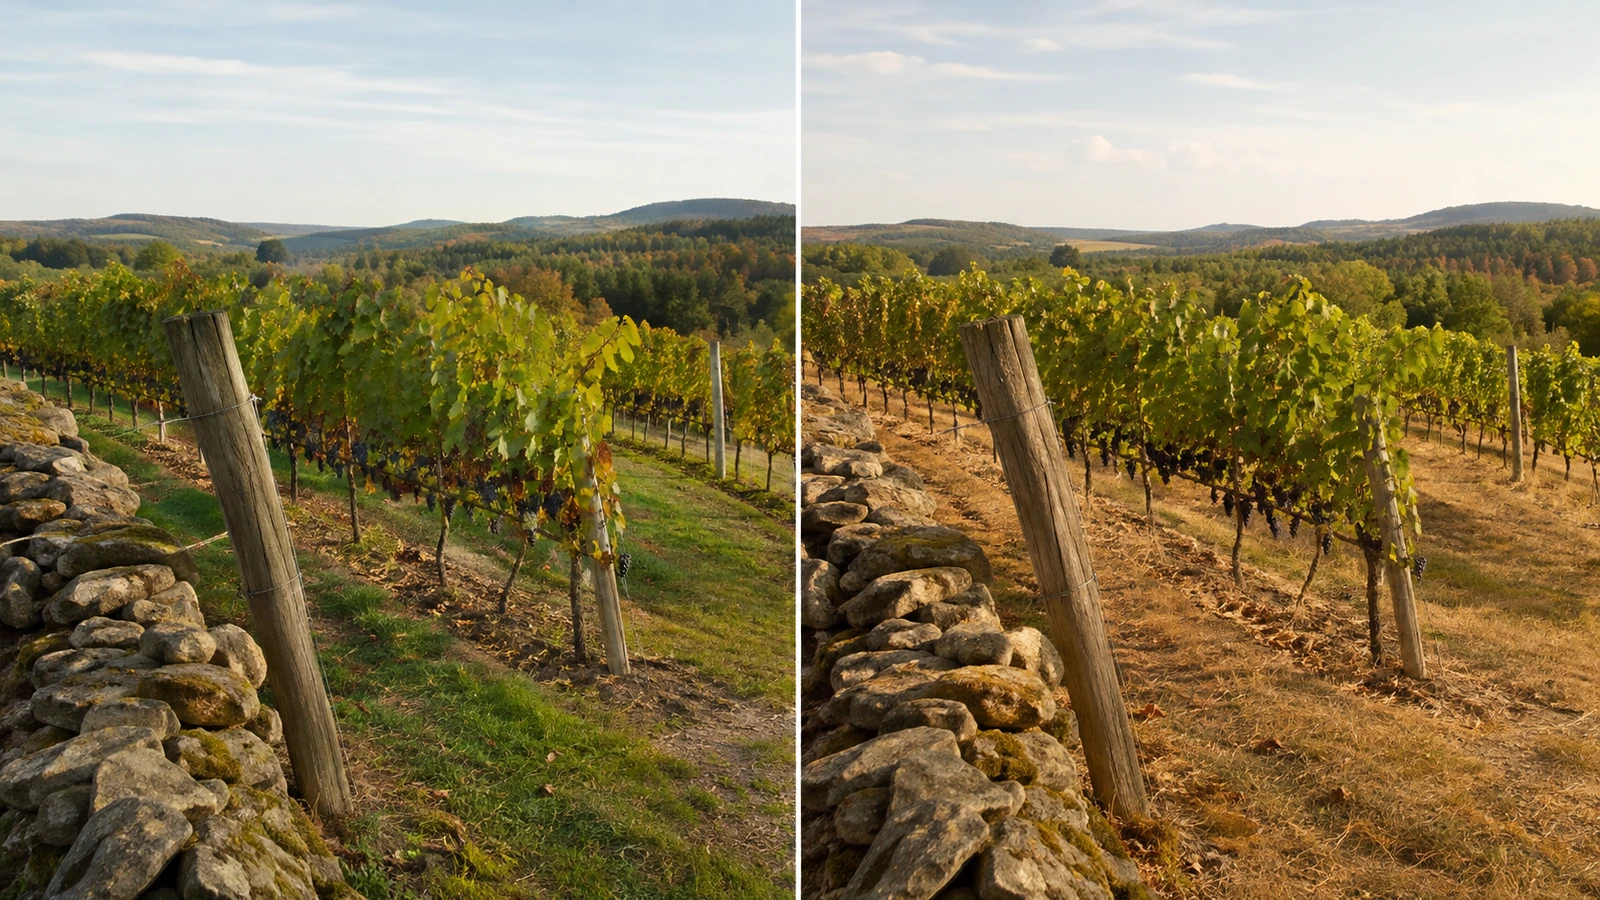
The stone wall is still there.
So is the bend in the row, the old post leaning slightly downhill, and the patch of pale soil that appears every summer between the vines.
The vineyard has not changed its address.
But open the harvest notebooks and the calendar begins to move. Budbreak arrives earlier. Flowering advances. Veraison slips into a warmer part of summer. Picking crews are called weeks before the dates that once felt normal. A parcel celebrated for catching every possible ray of sun may now need protection from the afternoon it used to welcome.
Same slope. Same name on the map.
A different season around it.
In our previous Cellar Journal article, we treated vineyard aspect as a timetable for energy. The hillside determined when light and warmth arrived—but only within the climate surrounding it.
Climate change moves that surrounding baseline.
The central idea: climate moves the baseline. Weather writes the season. The vine and the grower translate both into a vintage.
That distinction matters because wine conversations often collapse three different things into one sentence.
A hot afternoon becomes “climate change.” A famous vintage becomes proof that warming is good. A difficult bottle becomes evidence that an entire region is failing. A cool year is offered as evidence that the climate is not changing at all.
None of those conclusions is careful enough.
A vintage is not a thermometer reading. It is a sequence of weather, biological development, vineyard conditions, human decisions, and cellar choices compressed into one year on a label.
To understand how climate change is rewriting vintages, we have to read the sequence—not just the score.
Weather, vintage, and climate are different scales
Start with the vocabulary.
Weather is what happens over hours, days, and seasons: a frost on an April morning, rain during flowering, a heatwave before veraison, or a dry wind near harvest.
Climate is the statistical pattern around those events over much longer periods. The World Meteorological Organization uses 30-year periods for climatological standard normals, currently including 1991–2020 for operational comparison. The IPCC similarly defines climate through statistical description and climate change as a shift in climate properties that persists for decades or longer (WMO; IPCC AR6 WGII Glossary).
Vintage, in wine, is neither of those formal scientific units. It is the growing season and harvest year as expressed through grapes and, eventually, wine.
One hot vintage can be consistent with a warming climate. It does not establish the trend by itself.
One cool vintage can occur within a warming climate. It does not cancel the trend.
This is the first rule for reading climate and wine responsibly:
A season is evidence about a season. A climate claim requires a pattern.
Scientists also distinguish attribution from observation. Attribution evaluates how different causal factors changed the likelihood or intensity of an observed trend or event, usually with explicit uncertainty. A projection is conditional on assumptions and scenarios; it is not a precise forecast of what a named bottle will taste like decades from now (IPCC AR6 WGII Glossary).
Those distinctions may sound technical.
They are also the difference between explanation and theatre.
The baseline is already moving
Wine grapes preserve unusually long records of seasonal timing.
Harvest dates appear in municipal archives, estate notebooks, newspapers, appellation documents, and research stations. They are not perfect climate instruments—picking is also shaped by labor, law, style, disease, yield, technology, and the producer’s desired composition—but carefully reconstructed series can reveal powerful long-term patterns.
The Beaune harvest record in Burgundy is one of the most striking examples. Researchers reconstructed and homogenized a 664-year series from 1354 to 2018. Grapes were picked, on average, from September 28 during 1354–1987. During 1988–2018, harvest began an average of 13 days earlier, around September 15. The researchers also showed that exceptionally early seasons, once scattered historical outliers, became much more frequent in recent decades (Labbé et al., 2019).
The study deserves two readings at once.
The first is climatic: the recent shift is substantial.
The second is methodological: harvest dates are human decisions as well as biological outcomes. The authors had to correct archival biases, changing institutions, production styles, and the difference between official harvest bans and when growers actually picked.
A harvest date is therefore a powerful proxy.
It is not a passive thermometer.
Across the wider literature, a 2024 synthesis reported that harvests in most major winegrowing regions have advanced roughly two to three weeks over the past four decades, while higher temperatures have shifted ripening toward warmer parts of summer (van Leeuwen et al., 2024).
Long records from specific places reveal their own versions of that movement. In Trentino, northern Italy, a 1986–2022 dataset for Chardonnay and Teroldego found significant advances—roughly 20 to 30 days across the period—in the onset of major phenological stages. Yet seasonal interval lengths and wine-quality outcomes did not all move in the same direction, in part because growers adjusted harvest decisions to berry composition and sanitary condition (Faralli et al., 2024).
The lesson is not merely that the calendar is earlier.
It is that the relationship among the calendar, the vine, and the winemaker is being renegotiated.
An early harvest no longer tells the old story
For centuries, early harvests in parts of western Europe often accompanied summers that were both hot and dry. The logic seemed intuitive: drought favored the atmospheric conditions that produced extreme heat; heat accelerated development; harvest arrived early.
Then the relationship changed.
Cook and Wolkovich analyzed harvest and climate records from France and Switzerland spanning 1600–2007. In their model, warmer spring and summer temperatures were associated with earlier harvests—about six days earlier per degree Celsius—while wetter conditions delayed them. But after 1981, the historical relationship between drought and early harvest weakened. Anthropogenic warming could now generate temperatures associated with early harvest even without the drought conditions that had once been part of the pattern (Cook & Wolkovich, 2016).
This is climate change doing something more subtle than “making every year hotter.”
It is changing the relationships behind familiar signals.
An old regional rule may have been useful because several conditions once traveled together.
When the coupling changes, the rule may still sound traditional while becoming less diagnostic.
Climate change does not only move averages. It can change what one clue means about another.
That is why vintage knowledge must remain alive. A chart built from yesterday’s relationships cannot be treated as a timeless law.
A vintage is a sequence, not an average
Imagine two growing seasons with the same average temperature.
In the first, warmth is gradual. Spring is mild, flowering is dry, summer is steady, nights remain moderate, and rain arrives after harvest.
In the second, spring begins cool, a frost follows early budbreak, flowering is wet, July is ordinary, and a ten-day heatwave strikes during ripening.
The average may look similar.
The vines did not live through the same year.
This thought experiment illustrates why a seasonal mean cannot describe a vintage by itself. Timing, duration, intensity, and biological stage determine how weather is translated.
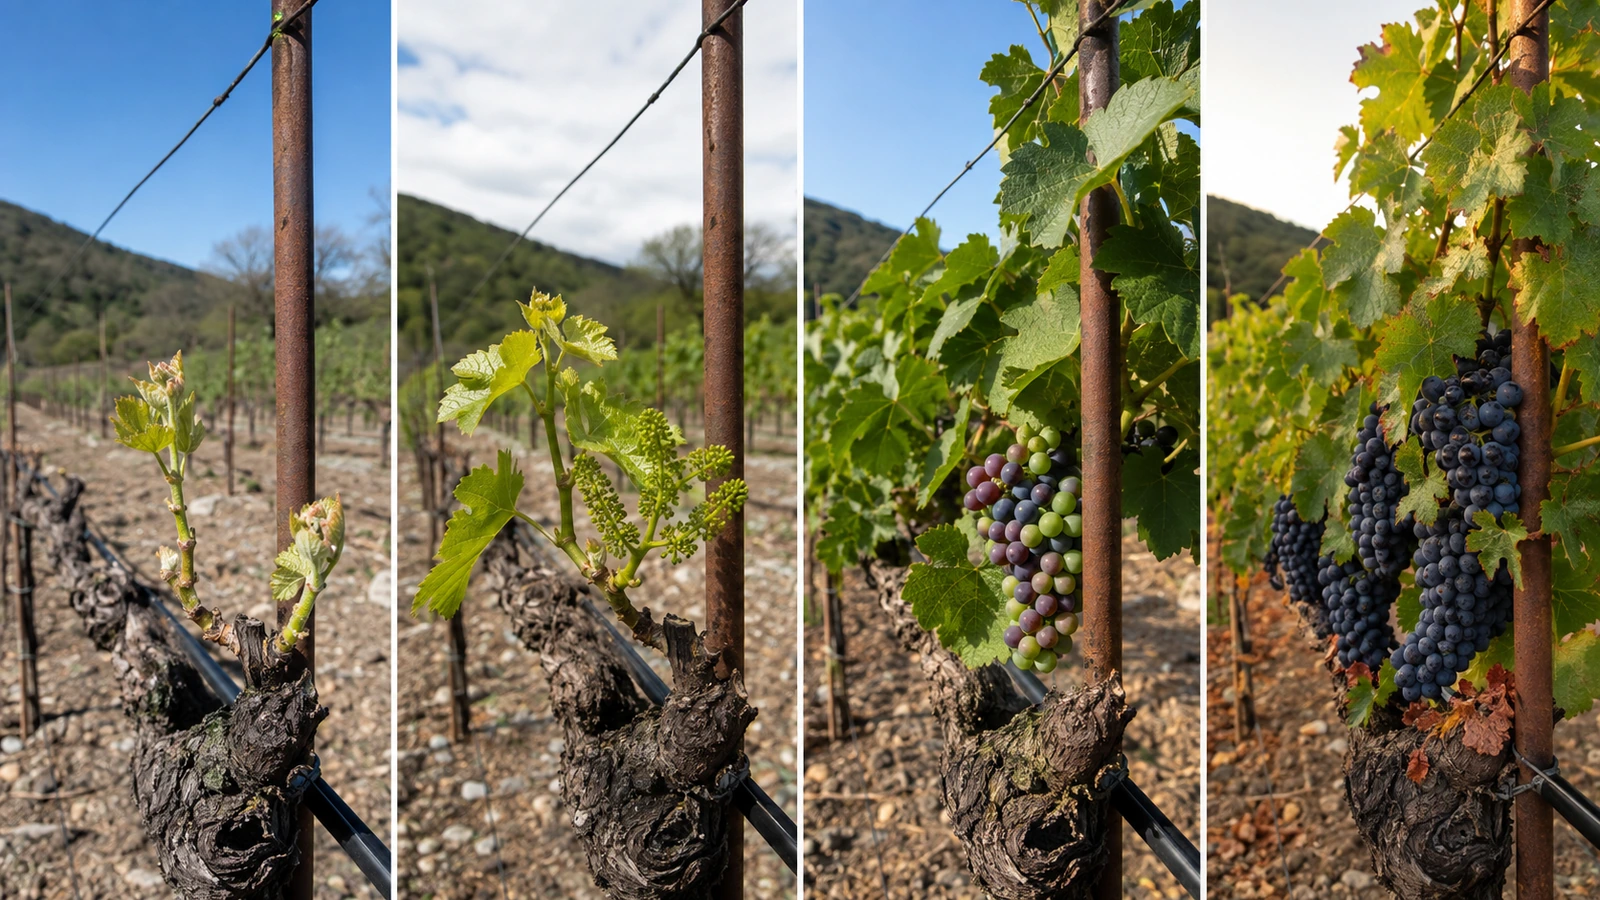
A vintage is a sequence of encounters:
- winter dormancy and chill;
- budbreak and frost exposure;
- flowering and fruit set;
- shoot growth and water demand;
- veraison;
- sugar, acid, color, tannin, and aroma development;
- disease pressure;
- harvest timing and condition.
Temperature is central to grapevine phenology, but its effect varies among stages, varieties, and sites. A comparison across 17 vineyards found that higher temperatures were associated with advances in budbreak, flowering, veraison, and harvest, while the magnitude of response differed among vineyards (Cameron et al., 2021).
The calendar does not simply slide forward as one intact block.
Each stage enters a new part of the season, where daylight, heat, humidity, water availability, and extreme-event probability may be different.
Earlier veraison can place ripening in hotter weeks.
Earlier budbreak can place tender shoots in the path of a frost that still occurs on a familiar date.
Earlier harvest can help preserve acidity—or reflect a forced decision before fruit loses balance, dehydrates, develops disease, or exceeds the desired sugar level.
The date alone does not tell us which story happened.
Ripeness has more than one clock
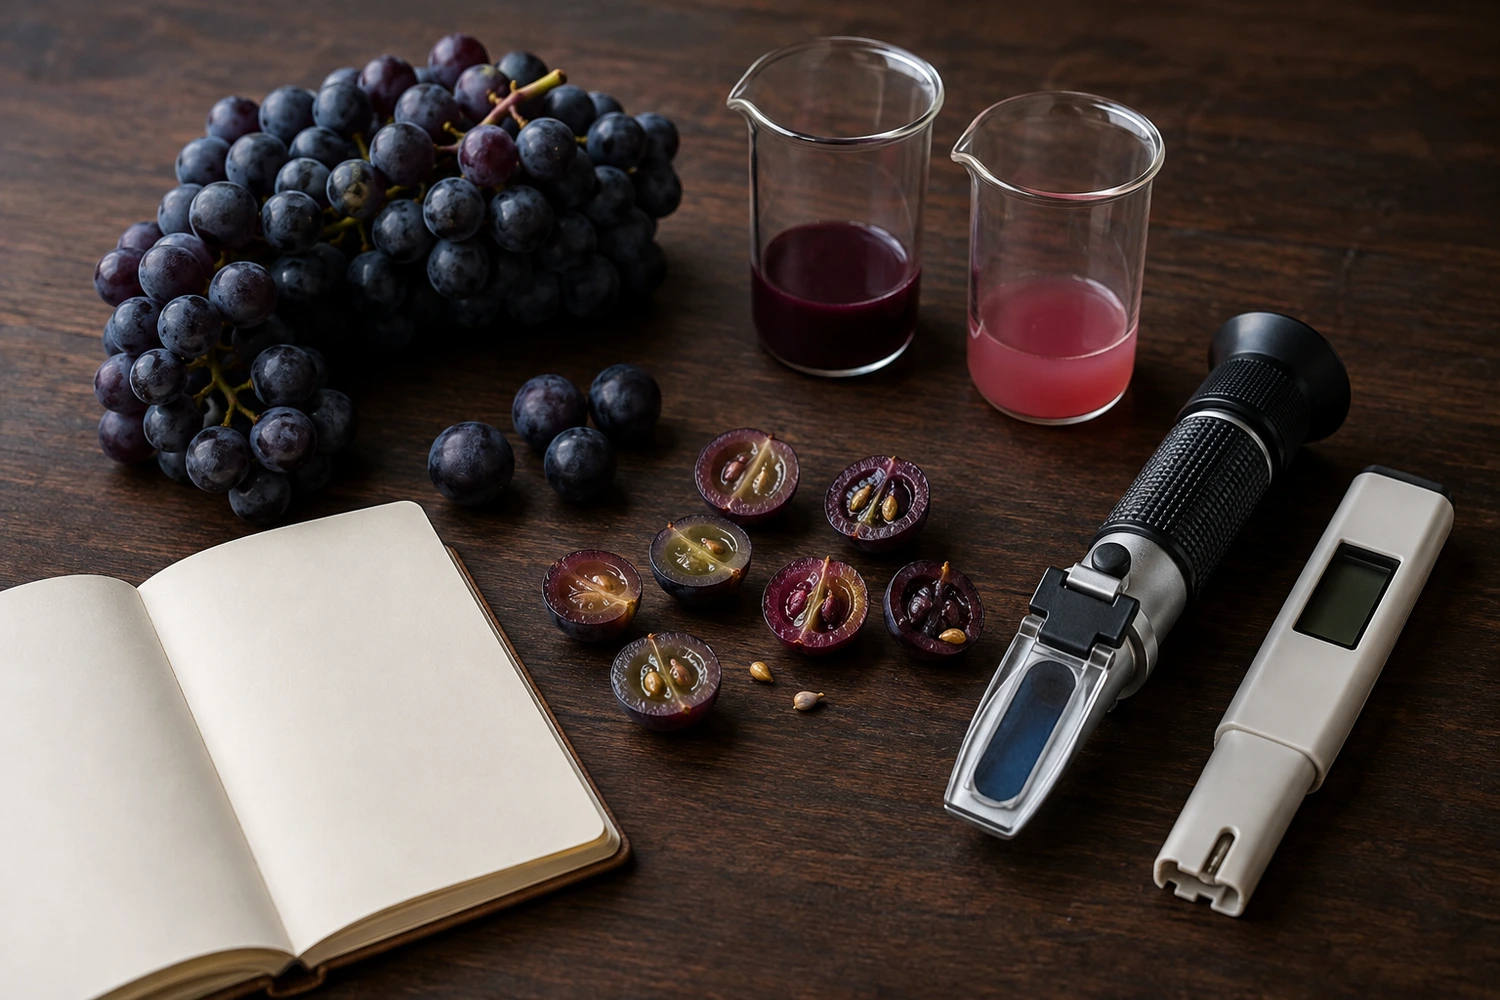
In the previous article, we established that ripeness is plural.
Climate change makes that distinction essential.
A grower is not waiting for one number called “ripe.” The decision may integrate:
- sugar concentration and potential alcohol;
- tartaric and malic acid, pH, and perceived freshness;
- skin and seed development;
- anthocyanins and tannins in red grapes;
- aroma compounds and precursors;
- berry integrity, hydration, and disease condition;
- the style the producer intends to make.
Warmer conditions do not move every clock at the same rate.
A field experiment with Shiraz and Cabernet Franc found that elevated temperature decoupled anthocyanin accumulation from sugar accumulation. The effect was driven mainly by a delay in the onset of anthocyanin accumulation relative to sugar, not by one universal change in every component of ripeness (Sadras & Moran, 2012).
That finding does not predict every red grape, region, or vintage.
It demonstrates the category error in assuming that more sugar means every dimension of maturity has advanced equally.
Broader reviews likewise describe how warmer ripening can be associated with more sugar, lower organic acids, and changes in secondary metabolites, aromas, and aroma precursors, while drought and radiation introduce additional, sometimes opposing, effects (van Leeuwen & Destrac-Irvine, 2017).
A grower may therefore face a choice with no perfect date:
Pick earlier for acidity and moderate sugar, while accepting less development in another dimension.
Wait for skins, seeds, color, or aroma, while sugar and potential alcohol continue to rise.
The climate did not merely make the grapes “riper.”
It separated the clocks.
A warm vintage is not the same as a heatwave
Wine language often treats warmth as a single continuum.
But a season that is modestly warmer overall is not biologically identical to a short episode of extreme heat.
Background warmth can advance development and improve ripening probability in a historically cool region. A heatwave can rapidly raise berry temperature, increase evaporative demand, intensify water stress, cause sunburn or dehydration, suppress photosynthesis under severe conditions, and alter particular components of berry composition.
The outcome depends on:
- when the event occurs;
- how hot it becomes;
- how long it lasts;
- night-time recovery;
- vine water status;
- canopy shade;
- variety and rootstock;
- soil water availability;
- the stage of berry development.
The same heat event does not have the same meaning at flowering, before veraison, during color development, or one day before harvest.
Nor does “hot vintage” prove that every vineyard experienced the same exposure. Elevation, slope, wind, cloud, soil, irrigation access, canopy architecture, and harvest date can create striking differences within one appellation.
Regional climate provides context.
The bottle remains specific.
Drought is not a synonym for concentration
A smaller berry can increase the ratio of skin to pulp. Moderate water deficit can reduce shoot growth and, in some red-wine contexts, favor certain compositional outcomes.
That is the origin of an appealing wine cliché:
Drought concentrates the grapes.
The more careful version is conditional.
Water deficit exists on a spectrum. Its timing and severity matter. Mild restriction may reduce vigor without severely limiting photosynthesis. Strong or prolonged stress can reduce carbon assimilation, berry growth, yield, and the vine’s ability to complete ripening. It can also interact with heat, radiation, soil depth, root system, salinity, crop load, and previous seasons.
The 2017 viticulture review by van Leeuwen and Destrac-Irvine explicitly distinguishes mild from severe deficit: mild deficit may favor some grape-composition outcomes, while severe stress can reduce sugar accumulation through depressed photosynthesis and impair quality, particularly in white-wine production (van Leeuwen & Destrac-Irvine, 2017).
A 2025 synthesis of drought adaptation emphasizes that grapevine response spans soil, roots, rootstock, scion, hydraulic behavior, canopy, and management—and that drought often arrives together with other stresses rather than alone (Ollat et al., 2025).
So when a vintage report says dry, Ask one more question:
Dry enough to moderate vigor—or dry enough to constrain the vine?
The adjective is not the mechanism.
The spring-frost paradox
A warming climate sounds as though it should reduce frost risk.
Sometimes it does.
But risk depends on both the frost event and the vine’s stage of development.
Warmer late-winter and early-spring conditions can advance budbreak. Tender green tissue may then be exposed when a later cold event arrives—even if the total number of frost days has declined.
Modeling for French vineyards found that future budbreak timing is likely to advance, while late-frost risk could increase in more continental regions under the modeled conditions. The magnitude depended on region and on the phenological model used (Sgubin et al., 2018).
The long Trentino dataset reached a related caution from observed conditions: earlier budbreak moved young growth closer to the period of possible late frost, even as the overall climate warmed (Faralli et al., 2024).
This is not a universal prediction that every vineyard will suffer more frost.
It is a reminder that biological timing can change faster than a hazard disappears.
A warmer spring can expose the vine earlier to the cold that remains.
Climate risk is often about synchronization.
Fire nearby does not automatically mean smoke-tainted wine
Wildfire seasons add another emotionally charged shorthand.
A fire in a wine region does not mean every vineyard was exposed to smoke. Smoke exposure does not mean every grape accumulated the same compounds. Exposed grapes do not guarantee that every finished wine will show the same sensory effect.
Timing, smoke density, duration, distance, wind, variety, berry-development stage, and winemaking choices matter.
The chemistry is nevertheless real. Research has identified glycosylated forms of smoke-derived volatile phenols in smoke-affected Chardonnay and Cabernet Sauvignon grapes and the resulting wines (Hayasaka et al., 2010).
The responsible conclusion is therefore neither denial nor panic.
It is specificity.
A “smoke year” is a regional alert to investigate—not a verdict on every bottle.
Climate change does not make every wine worse
Wine needs warmth.
Regions near the cool margin of grape ripening can benefit, at least for a time, from warmer conditions: more reliable maturity, fewer green characters in certain varieties, new stylistic possibilities, or reduced disease pressure in some seasons. New regions can also become climatically suitable.
That is part of the evidence.
So are the costs.
As warming increases, benefits can narrow or reverse. Ripening may move into hotter periods. Drought and heatwaves can reduce yield and compromise balance. Water demand can rise. Pests, diseases, heavy rainfall, fire, and extreme events may change unevenly. Expansion toward higher elevations or latitudes can create ecological and land-use pressures (van Leeuwen et al., 2024).
The Trentino study is useful precisely because it resists a simple tragedy narrative. Across the dataset, white-wine quality ratings improved while red and sparkling wines remained statistically unaffected. The authors proposed that precise harvest decisions helped preserve outcomes despite substantial phenological advance (Faralli et al., 2024).
That does not prove warming improves wine.
It demonstrates that outcome is mediated by starting climate, variety, style, management, and the range of change.
Climate change has no single wine style. It changes the conditions under which style must be achieved.
The vintage chart needs a new grammar
Vintage charts can still be useful.
They can summarize broad regional conditions, identify years worth investigating, and provide context when comparing producers. What they cannot do is compress an entire region into one deterministic score.
Climate change makes their limitations more visible.
Historical shorthand may fail in several ways:
| Familiar shorthand | A more careful reading | What it does not prove |
|---|---|---|
| Early harvest | Warmth, drought, disease pressure, style targets, or a deliberate attempt to preserve balance may have advanced picking. | That the season was uniformly hot, dry, successful, or poor. |
| High alcohol vintage | Grapes may have accumulated more sugar, been harvested later, dehydrated, or been vinified toward a richer style. | That every producer made high-alcohol wine or that phenolic and aromatic maturity were synchronized. |
| Low-acid year | Warm ripening and malic-acid loss may have contributed, alongside variety, site, yield, and harvest timing. | That every vineyard or wine lacks freshness. |
| Drought vintage | Water limitation may have reduced vigor, berry size, yield, or photosynthesis depending on severity and timing. | Automatic concentration, quality, or longevity. |
| Cool vintage | Development may have proceeded more slowly, with possible freshness and later harvest. | Failure to ripen, high acidity, or poor quality across all sites. |
| Warm vintage | Development and harvest may have advanced; some cool sites may have benefited while warm sites faced excess. | Universal ripeness, richness, or quality. |
| Smoke year | Some vineyards may require exposure and chemistry assessment. | That every bottle is smoke-affected. |
| High regional score | Broad conditions may have favored the evaluator’s preferred style. | That every producer, parcel, grape, or bottle performed equally. |
| Climate-resilient variety | A cultivar may offer useful phenology or stress tolerance under defined conditions. | Permanent suitability, identical wine style, or freedom from future risk. |
A vintage chart is a map.
The producer, parcel, grape, harvest decision, and bottle are the terrain.
Growers are not passive observers
The vine cannot move itself uphill.
The grower can change how it encounters the season.
Adaptation operates across different time horizons.
Within a season
Growers may adjust:
- canopy shade and leaf removal;
- irrigation where water is legal, available, and sustainable;
- floor and soil management;
- crop load;
- picking sequence;
- harvest time of day;
- sorting and winery logistics.
Across several seasons
They may change:
- pruning date;
- trunk height and training system;
- canopy architecture;
- rootstock or clone selection in new plantings;
- cover crops and soil-water strategy;
- frost or heat protection;
- monitoring and decision systems.
Across decades
Regions may reconsider:
- varieties;
- sites, elevations, and exposures;
- appellation rules;
- water infrastructure;
- labor and harvest capacity;
- what regional typicity can preserve while still changing.
No adaptation is a free switch.
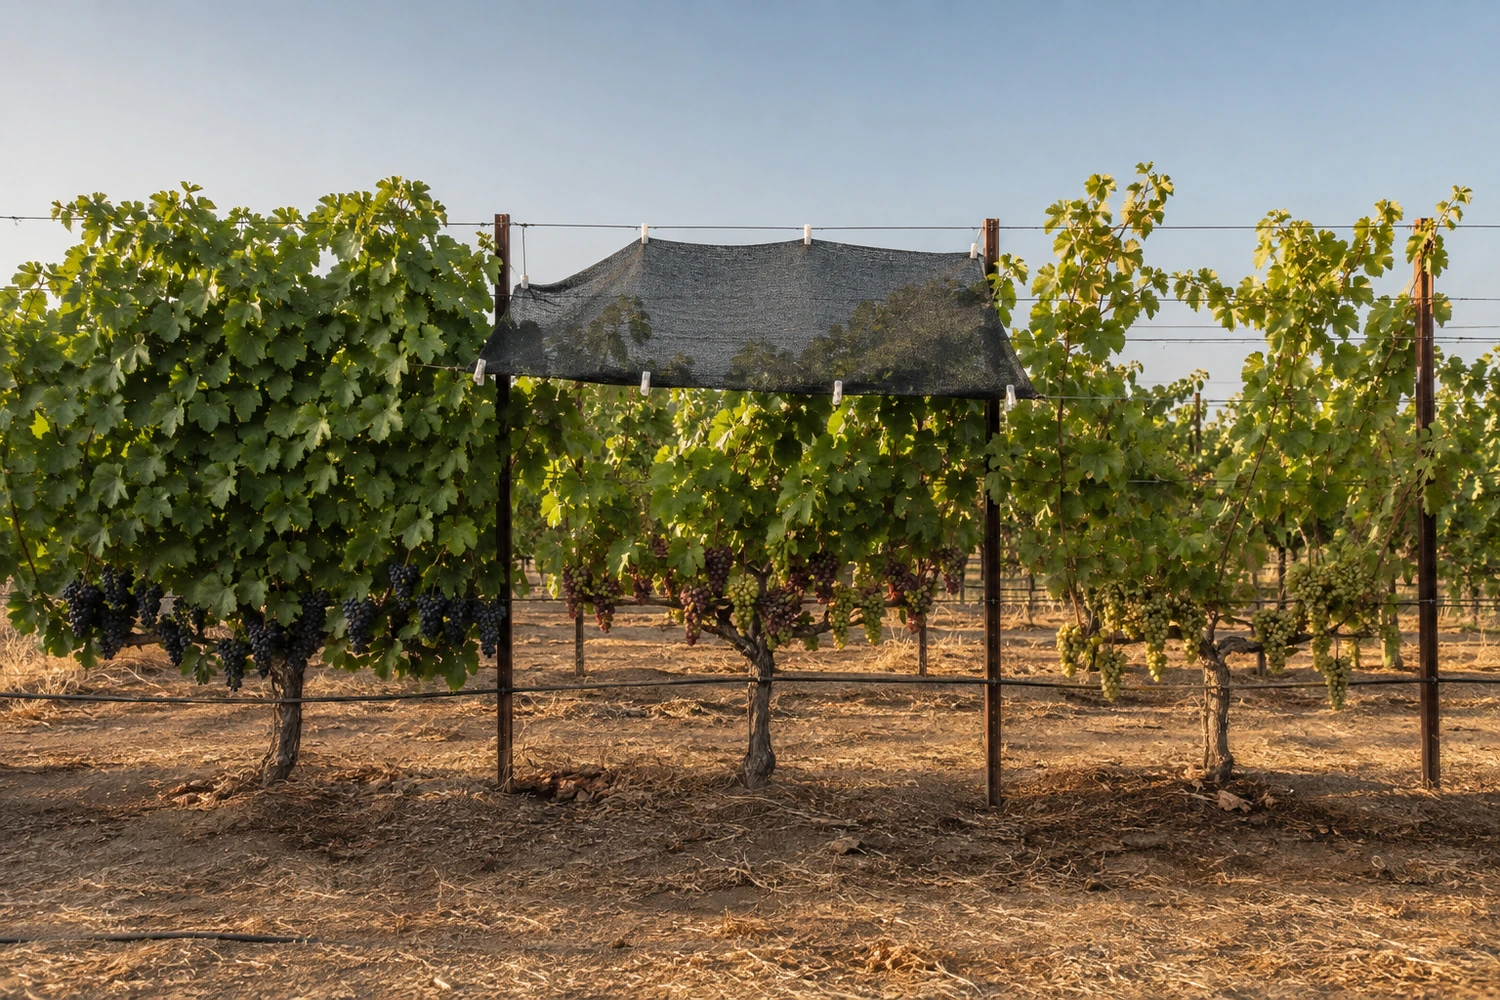
Shading nets, for example, can reduce cluster temperature, slow sugar accumulation, preserve acidity, and limit sunburn in certain hot conditions. They can also reduce photosynthesis, alter phenolic development, affect reserves, and produce different results by cultivar, timing, shade intensity, and climate (Pallotti et al., 2023).
Late pruning can delay development, but one two-year trial in Maturana vines in Rioja found severe yield reductions when pruning was imposed at later phenological stages (Zheng et al., 2017).
A technique that solves one clock may create a cost somewhere else.
Adaptation is not the removal of trade-offs. It is the management of them.
Varieties are part of the adaptation vocabulary
Wine regions are often imagined through a fixed marriage of place and grape.
History is less still than that image suggests. Varieties have moved, regulations have changed, and regional styles have evolved many times. Climate change is forcing a new version of that conversation.
Different cultivars require different amounts of heat and time to reach flowering, veraison, and target sugar levels. Temperature-based phenology models can help compare how earlier- and later-developing varieties may fit future conditions, though model performance, site behavior, style, disease, water, and market acceptance remain separate questions (Parker et al., 2020).
A global modeling study using 11 cultivars found that allowing shifts among varieties substantially reduced projected losses of climatically suitable current winegrowing area under 2 °C and 4 °C warming scenarios. The protection was incomplete and much smaller under stronger warming. These were modelled suitability outcomes—not guarantees of yield, quality, legal approval, producer adoption, or consumer acceptance (Morales-Castilla et al., 2020).
The International Organisation of Vine and Wine therefore recommends research and coordinated testing of existing varieties, ancient cultivars, new selections, and rootstocks across different environments, while preserving genetic resources and biodiversity (OIV-VITI 652-2021).
Variety change is powerful because it changes the vine’s calendar and stress response at the biological level.
It is also culturally expensive.
A later-ripening grape may fit the future climate while challenging the legal, sensory, commercial, and emotional identity of the region.
That is not a reason to reject adaptation.
It is a reason to understand what is being preserved.
When rules protect identity—and restrict movement
Appellation systems can protect origin, inherited knowledge, varieties, methods, and consumer trust.
The same specificity can make adaptation slower.
A 2024 study assessed climate vulnerability across 1,085 European protected designations of origin using indicators of exposure, sensitivity, and adaptive capacity. The authors found that restrictive variety portfolios could increase sensitivity in some regions, while financial, natural, physical, social, and human resources shaped capacity to adapt. They explicitly presented the results as a comparative continental index, not a parcel-level forecast or immutable ranking. The article was updated after an author correction in May 2026 (Tscholl et al., 2024, updated 2026).
Bordeaux offers a current example of negotiated change. The regional trade body states that Bordeaux and Bordeaux Supérieur have authorized seven adaptation varieties—four red and three white—subject to limits of 5% of planted vineyard area and 10% of the final blend, without naming those varieties on the label under the stated rules. The same official page describes delayed pruning, reduced leaf removal, night harvest, and other measures under evaluation or use (Bordeaux.com, accessed September 2026).
This is not proof that one region has solved climate change.
It is evidence that regional identity can be treated as a living agreement rather than a museum case.
Research from Latin America reinforces the importance of place-specific adaptation. A 2026 systematic review of 43 peer-reviewed studies across Argentina, Chile, Mexico, Uruguay, and Brazil grouped adaptation into four broad pathways: expansion into new areas, agronomic management, protection from extremes, and technological or monitoring innovation. The authors also emphasized uneven research and technological capacity across territories (Ríos-Núñez et al., 2026).
There is no single global vineyard.
There will be no single global solution.
Adaptation and mitigation are not interchangeable
Adaptation reduces vulnerability to the climate conditions a vineyard faces.
Mitigation reduces the greenhouse-gas emissions or enhances the sinks that shape future warming.
A shade cloth can protect a row during an extreme afternoon.
It cannot stabilize the global climate.
A later-ripening variety can recover part of a harvest window.
It does not guarantee that the window remains viable under unlimited warming.
The modeling on cultivar diversity illustrates this limit: variety turnover offered substantial protection at 2 °C, but less protection at 4 °C (Morales-Castilla et al., 2020). The broader 2024 synthesis likewise concludes that vineyard adaptations can preserve production only up to a certain level of warming in some places (van Leeuwen et al., 2024).
The useful distinction is simple:
Adaptation buys room. Mitigation helps determine how much room remains.
A serious wine-climate conversation needs both.
The Ask Sommelier AI Six-Pass Vintage Read
A vintage should not be reduced to hot, cool, great, or difficult.
Use six passes.
1. Baseline
Ask what has changed over decades in the region:
- average and extreme temperatures;
- phenology and harvest timing;
- rainfall and water balance;
- frost, heat, or disease conditions;
- the reference period behind the comparison.
One year is not the baseline.
2. Sequence
Rebuild the season in order:
- dormancy and budbreak;
- flowering and fruit set;
- veraison;
- ripening;
- harvest.
A favorable event at one stage can be harmful at another.
3. Extremes
Locate the important events:
- frost;
- heatwave;
- drought;
- heavy rain;
- fire or smoke exposure;
- hail or wind, where documented.
Record timing, duration, severity, and geographical reach. Do not let the event’s name replace those details.
4. Ripeness
Separate the clocks:
- sugar;
- acid and pH;
- phenolic development;
- aroma and precursors;
- berry condition;
- disease pressure.
“Ripe” is a conclusion assembled from several measurements and goals.
5. Response
Ask what the producer did:
- canopy and water management;
- sorting;
- harvest date and sequence;
- night versus daytime picking;
- extraction, acidification, enrichment, blending, or other legally permitted cellar decisions where verified.
The vintage happened to the vineyard.
The wine was still made by someone.
6. Bottle
Return to the specific wine.
Taste it. Read producer information critically. Compare independent sources. Consider storage and bottle variation. State what is known, plausible, and unknown.
Baseline → sequence → extremes → ripeness → response → bottle.
This is an Ask Sommelier AI editorial framework, not a validated meteorological or viticultural protocol. Its purpose is to keep the reasoning chain visible.
How Ask Sommelier AI should use vintage information
Vintage intelligence can make a recommendation more useful—but only when the system respects scale.
Ask Sommelier AI should:
- date-stamp and link climate-sensitive regional information;
- distinguish observed records from projections;
- separate regional conditions from producer and parcel outcomes;
- treat vintage scores as one editorial signal, not ground truth;
- prefer verified harvest, composition, producer, and technical information when available;
- expose uncertainty when conditions vary within the region;
- avoid predicting exact alcohol, acidity, quality, or drinking window from weather alone;
- explain when adaptation may have changed the expected regional pattern.
The app helps with the choice.
The Journal protects the chain of reasoning.
How to buy a vintage in a changing climate
You do not need to become a climatologist before ordering dinner.
Use a shorter version of the method:
- Start with region and variety. Climate pressure is not uniform.
- Read the seasonal story, not only the score. Look for the timing of heat, rain, frost, and harvest.
- Prioritize producer execution. Skilled growers can create very different outcomes within the same year.
- Consider site. Cooler exposures, elevation, soil water, and airflow may matter more in a warm year; sheltered or warmer sites may matter more in a cool one.
- Taste the bottle in front of you. A vintage reputation is context—not a substitute for the wine.
The best vintage is not always the highest-scoring year.
It may be the year whose structure, ripeness, freshness, and producer style fit your palate and the moment you plan to open it.
Frequently asked questions
Can one hot vintage prove climate change?
No. A single season can be consistent with a long-term trend, but climate change is identified through persistent changes in climate statistics over decades. Attribution of a specific event requires separate analysis.
Does climate change always make wine worse?
No. Some historically cool regions or varieties may initially benefit from more reliable ripening. Other places may face excessive heat, drought, altered acidity, compressed harvests, or extreme events. Benefits and harms depend on location, variety, style, adaptation, and the amount of warming.
Why are many grape harvests happening earlier?
Higher temperatures generally accelerate grapevine development, and earlier phenological stages can shift ripening and harvest forward. Water, disease, composition targets, labor, and producer choices also influence the final date.
Does earlier harvest mean the grapes were less ripe?
Not necessarily. Grapes can reach a target sugar level earlier under warmer conditions. Producers may also pick earlier to protect acidity, avoid heat or rain, or preserve a desired style. Other dimensions of ripeness may not be synchronized.
Can a warming climate still produce cool vintages and spring frost?
Yes. Climate describes a long-term distribution, not the elimination of variability. Earlier budbreak can also expose tender tissue to a later cold event even if winters become milder overall.
Does drought make better wine?
Not automatically. Moderate water deficit can be useful in some contexts. Severe or poorly timed stress can reduce photosynthesis, yield, berry development, and quality. Site, soil, variety, rootstock, crop load, and water access matter.
Will traditional wine regions have to change grapes?
Some regions are already testing or authorizing additional varieties and rootstocks. Whether a change is useful depends on phenology, water and heat response, wine style, law, economics, cultural identity, and consumer acceptance.
Are vintage charts still useful?
Yes—as regional starting points. They should not be treated as bottle-level verdicts, especially when climate, adaptation, parcel differences, and producer choices are changing established relationships.
The label gives us a place and a year
Return to the stone wall.
The old post still leans downhill. The row still bends around the same pale patch of soil. The name on the label still points to the same place.
But place has never meant geography alone.
It also means the climate that surrounds the slope, the variety growing there, the water the roots can reach, the hazards that arrive, and the decisions made before the grapes leave the vineyard.
Those relationships are changing.
Some wines will become riper. Some will be picked earlier. Some will preserve their identity through careful adaptation. Some regions will revise what they plant. Some old assumptions will become less reliable, while new places begin writing traditions of their own.
The vineyard keeps its address.
The vintage records what changed around it—and what people chose to do.
The label gives us a place and a year. The wine gives us the translation.
References — English
- World Meteorological Organization. WMO Climatological Normals. Accessed September 2026.
- IPCC. Annex II: Glossary — Climate Change 2022: Impacts, Adaptation and Vulnerability. Cambridge University Press, 2022.
- van Leeuwen, C., Sgubin, G., Bois, B., et al. Climate change impacts and adaptations of wine production. Nature Reviews Earth & Environment 5, 258–275 (2024).
- Labbé, T., Pfister, C., Brönnimann, S., et al. The longest homogeneous series of grape harvest dates, Beaune 1354–2018, and its significance for the understanding of past and present climate. Climate of the Past 15, 1485–1501 (2019).
- Cook, B. I. & Wolkovich, E. M. Climate change decouples drought from early wine grape harvests in France. Nature Climate Change 6, 715–719 (2016).
- Faralli, M., Mallucci, S., Bignardi, A., Varner, M. & Bertamini, M. Four decades in the vineyard: the impact of climate change on grapevine phenology and wine quality in northern Italy. OENO One 58(3) (2024).
- Cameron, W., Petrie, P. R., Barlow, E. W. R., Howell, K., Jarvis, C. & Fuentes, S. A comparison of the effect of temperature on grapevine phenology between vineyards. OENO One 55(2) (2021).
- Sadras, V. O. & Moran, M. A. Elevated temperature decouples anthocyanins and sugars in berries of Shiraz and Cabernet Franc. Australian Journal of Grape and Wine Research 18, 115–122 (2012).
- van Leeuwen, C. & Destrac-Irvine, A. Modified grape composition under climate change conditions requires adaptations in the vineyard. OENO One 51(2) (2017).
- Ollat, N., de Miguel, M., Saint Cast, C., et al. From soil to canopy: the diversity of adaptation strategies to drought in grapevine. OENO One 59(3) (2025).
- Sgubin, G., Swingedouw, D., Dayon, G., García de Cortázar-Atauri, I., Ollat, N., Pagé, C. & van Leeuwen, C. The risk of tardive frost damage in French vineyards in a changing climate. Agricultural and Forest Meteorology 250–251, 226–242 (2018).
- Hayasaka, Y., Baldock, G. A., Parker, M., et al. Glycosylation of smoke-derived volatile phenols in grapes as a consequence of grapevine exposure to bushfire smoke. Journal of Agricultural and Food Chemistry 58, 10989–10998 (2010).
- Pallotti, L., Silvestroni, O., Dottori, E., Lattanzi, T. & Lanari, V. Effects of shading nets as a form of adaptation to climate change on grapes production: a review. OENO One 57(2) (2023).
- Zheng, W., García, J., Balda, P. & Martínez de Toda, F. Effects of late winter pruning at different phenological stages on vine yield components and berry composition in La Rioja, North-central Spain. OENO One 51(4) (2017).
- Parker, A. K., García de Cortázar-Atauri, I., Trought, M. C. T., et al. Adaptation to climate change by determining grapevine cultivar differences using temperature-based phenology models. OENO One 54(4) (2020).
- Morales-Castilla, I., García de Cortázar-Atauri, I., Cook, B. I., et al. Diversity buffers winegrowing regions from climate change losses. Proceedings of the National Academy of Sciences 117, 2864–2869 (2020). Note: supporting-information correction published in 2020.
- International Organisation of Vine and Wine. OIV recommendations concerning the selection and breeding of grapevine varieties for their adaptation to the effects of climate change — Resolution OIV-VITI 652-2021. In force; accessed September 2026.
- Tscholl, S., Candiago, S., Marsoner, T., et al. Climate resilience of European wine regions. Nature Communications 15, 6254 (2024), updated after author correction published May 2026.
- Bordeaux.com. How Bordeaux Is Adapting to Climate Change. Official regional page; accessed September 2026.
- Ríos-Núñez, S., Durofil, A. & Radice, M. Climate change and viticulture in Latin America: toward knowledge-based and territory-driven adaptation strategies. OENO One 60(1) (2026).